

Project complexity or how to compare apples and oranges
Nowadays the word ‘project’ is one the most popular and trendy terms. There is a tendency to project everything: from a minor life phase to conquering galaxies. I’m not going to dig into details of misusing the term ‘project’ and ‘project management’ activities associated with it. I would rather stick to the classical project definition and make an attempt to find a way of comparing projects belonging to diverse application areas.
The skyrocketing development of technologies boosts new business segments and secures the importance of project management for a dozen years ahead. A project is a temporary entity aimed to deliver a product, a service, or a result according to a specific business case. It is not an operational activity and has inherent characteristics, which distinguish it from day-to-day business. Each project is unique, lies at the intersection of the three interdependent targets: time, budget, and result(s), and always possesses a risk of not achieving some or all of these targets. It requires a special team or even a project organization to ensure proper management and the desired outcome. And last, but not least: a project has complexity.
What is actually project complexity?
There are different dimensions affecting the complexity of a project. For example, budget, duration, the intricacy of applied technologies, controllability of key stakeholders, difficulty in handling involved groups with specific clout (contractors, authorities, etc.), the existence of high political risks, and many others, which can be derived from the PESTLE or other comparable analysis techniques.
There are no unambiguous dimensions for complexity, which are valid for all projects. In practice, each company selects appropriate dimensions and sets its own parameters to complexity to differentiate its projects. Project budget is the most commonly used characteristic of project complexity. For a homogeneous project portfolio, this one-dimension differentiator totally makes sense and works perfectly. However, for a portfolio, which embraces diverse projects from a variety of industries, adhesion to one dimension of complexity will likely lead to a comparison of apples and oranges. It is not an easy task to define complexity by setting practical parameters of comparison for a diversified group of projects. Obviously, several dimensions should be used to emphasize core differences, risks, or critical factors for these projects. Depending on a company’s internal standards a presentation of complexity for heterogeneous projects can be visualized by charts and diagrams, categorized by weighted characteristics, or other approaches might be used to support an illustration of the selected data sets.
Comparison of diverse projects
The nature of any project is its uniqueness. For R&D projects this statement has apparent validity, in other fields project originality assumes a unique combination of phases and features suitable for the specific case. To provide one of the possible ways of comparing totally different projects, I’d like to demonstrate some real-world projects as an example.
A small company with top technical expertise in some niche areas, that designs its own high-tech products and develops exclusive solutions for customers’ projects, has taken a development project for a very specific business case. The project is to be based on one of the emerging technologies. There is no evidence or reference suggesting that the selected technology has ever been applied to similar tasks. However, some key stakeholders on the customer side are excited about this project because its successful results integrated into their own products might give their company a drastic competitive advantage. The estimated project duration is 12-18 months, the planned budget is 0,5 million Euro.
A huge international company with branches in more than 20 countries decides to implement a modern cloud-based recruiting system. This new corporate solution has to replace all local recruiting systems, must be integrated with other HR tools, and is to fully comply with corporate IT policies. Its implementation most probably entails significant changes in corporate and local HR processes. At the same time, a unified solution is to yield a significant cost-saving effect in the future. The project has received support from the company’s top management. The planned project duration is about one year, the estimated budget is around one million Euro.
A medium-sized company, that actively cooperates with a lot of contractors good at specific parts of construction work, manages a project to build a small tunnel in a mountain. The tunnel will help to reduce transit traffic intensity in the nearest city. At the same time, this mountain area is inhabited by species whose wellbeing during the construction phase might raise concerns among local environmentalists. The estimated project budget is more than ten million Euro, the estimated duration is 18 months.
To visualize a possible comparison of the above-mentioned projects I decided to use a well-known bubble chart, which is a common illustrative tool for a data set with two to four dimensions. The first two dimensions are presented as coordinates, the third as bubble-size, and the fourth as color. The beauty of this chart is that depending on your need and available data it is possible to use a two-dimensional picture or extends it to a three- or even four-dimensional presentation of data without sacrificing readability.
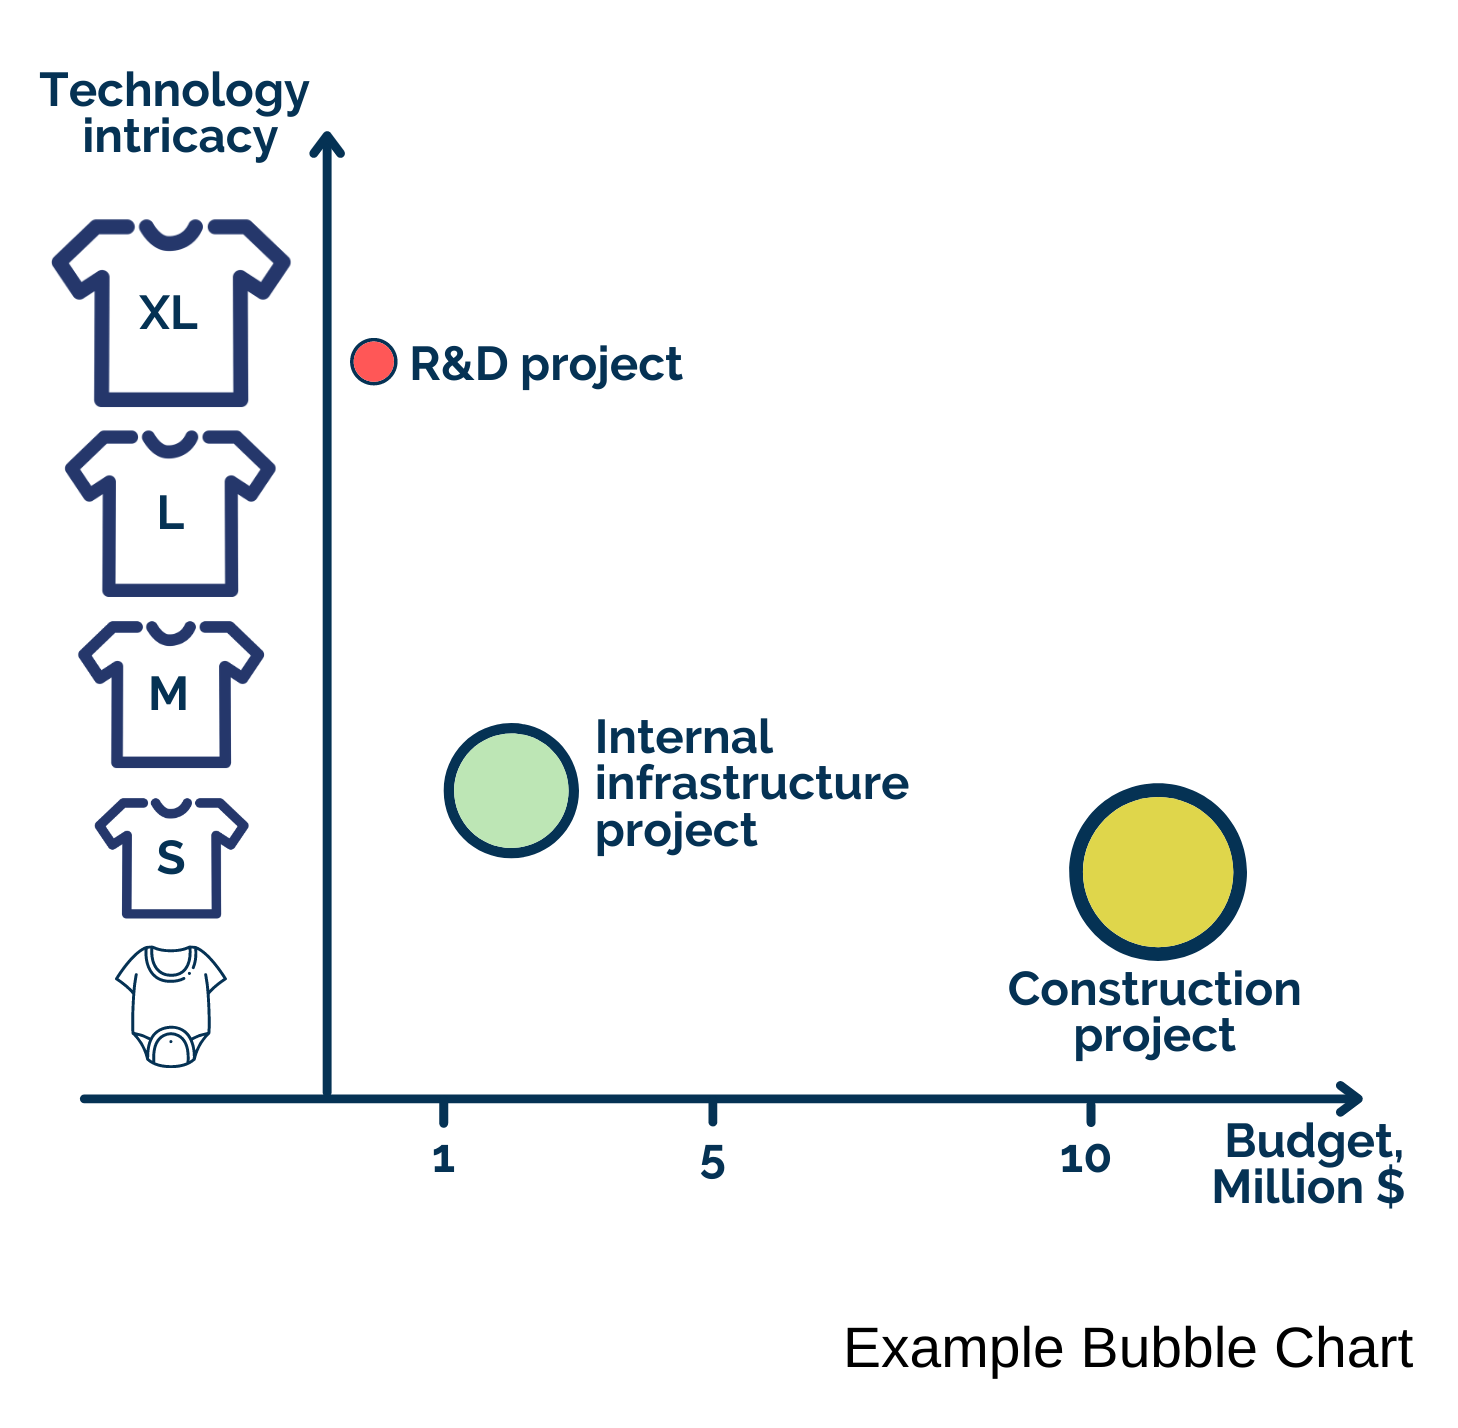
I’ve selected the following dimensions: budget, technology, and stakeholder. From my point of view, these parameters have eye-catching differences for these projects and can be placed as coordinates and bubble-size to visualize the distinctions. Owing to the availability of quantitative data about the budgets, it is possible to use a discrete numerical scale for this dimension, while some ordinal scales should be applied to the rest. For the fourth dimension I’ve used an estimated probability of the risk, that the project outcome won’t reach one or more targets (results, budget, time), and the simple ordinal scale (low-medium-high) for color-coding.
These differentiators were chosen based on available project pitches and for illustrative purposes only. The more project details are available, the richer the field of possible dimensions, parameters, scales, and comparison methods becomes. However, before starting a selection of suitable characteristics you should have a clear vision of what you would like to get as a result keeping the intended application in mind. It will help a lot to reduce overdoing and waste of effort during this exciting exercise.
In dealing with diverse projects the reasonable usage of multi-dimensional criteria to highlight project complexity serves as a helpful instrument to get a targeted snapshot of projects’ overview, to monitor and keep a project portfolio balance, and can support in ‘go/ no go’ decision making about new projects.
Read this article on LinkedIn