
Top 10 Root Cause Analysis methods
“We do not think as long as things run along smoothly for us. It is only when the routine is disrupted by the intrusion of a difficulty, obstacle, or challenge that we are forced to stop drifting and to think what we are going to do.” John Dewey
Different areas commonly encounter situations in daily work where the outcome differs from the desired performance, such as sales, project management, production, and service. These variations usually entail negative effects on business and problems that should be fixed. Some issues require known immediate actions; others should be carefully investigated and analyzed to come up with an applicable solution. Root cause analysis (RCA) is an essential part of the problem-solving process, and it is the cornerstone of a company’s continuous improvement efforts.
Finding the cause of an undesired occurrence is a challenging task, and a proper approach must be selected among alternatives. The big domain of qualitative methods can be used as a starter during brainstorming sessions and help identify issues and formulate the principal problem. To assess and validate findings and strengthen the results, it makes sense to combine and supplement the analysis with quantitative instruments. The palette of RCA techniques is very diverse in terms of complexity, frequency of usage, and application areas. Some of the commonly exercised ones are described below.
5 Whys
This is a quick and simple tool for identifying causes through the exploration of direct cause-and-effect relationships. Toyota Motor Corporation originally developed and applied it. Today, it is part of standard problem-solving techniques used by Kaizen, Lean, and Six Sigma professionals.
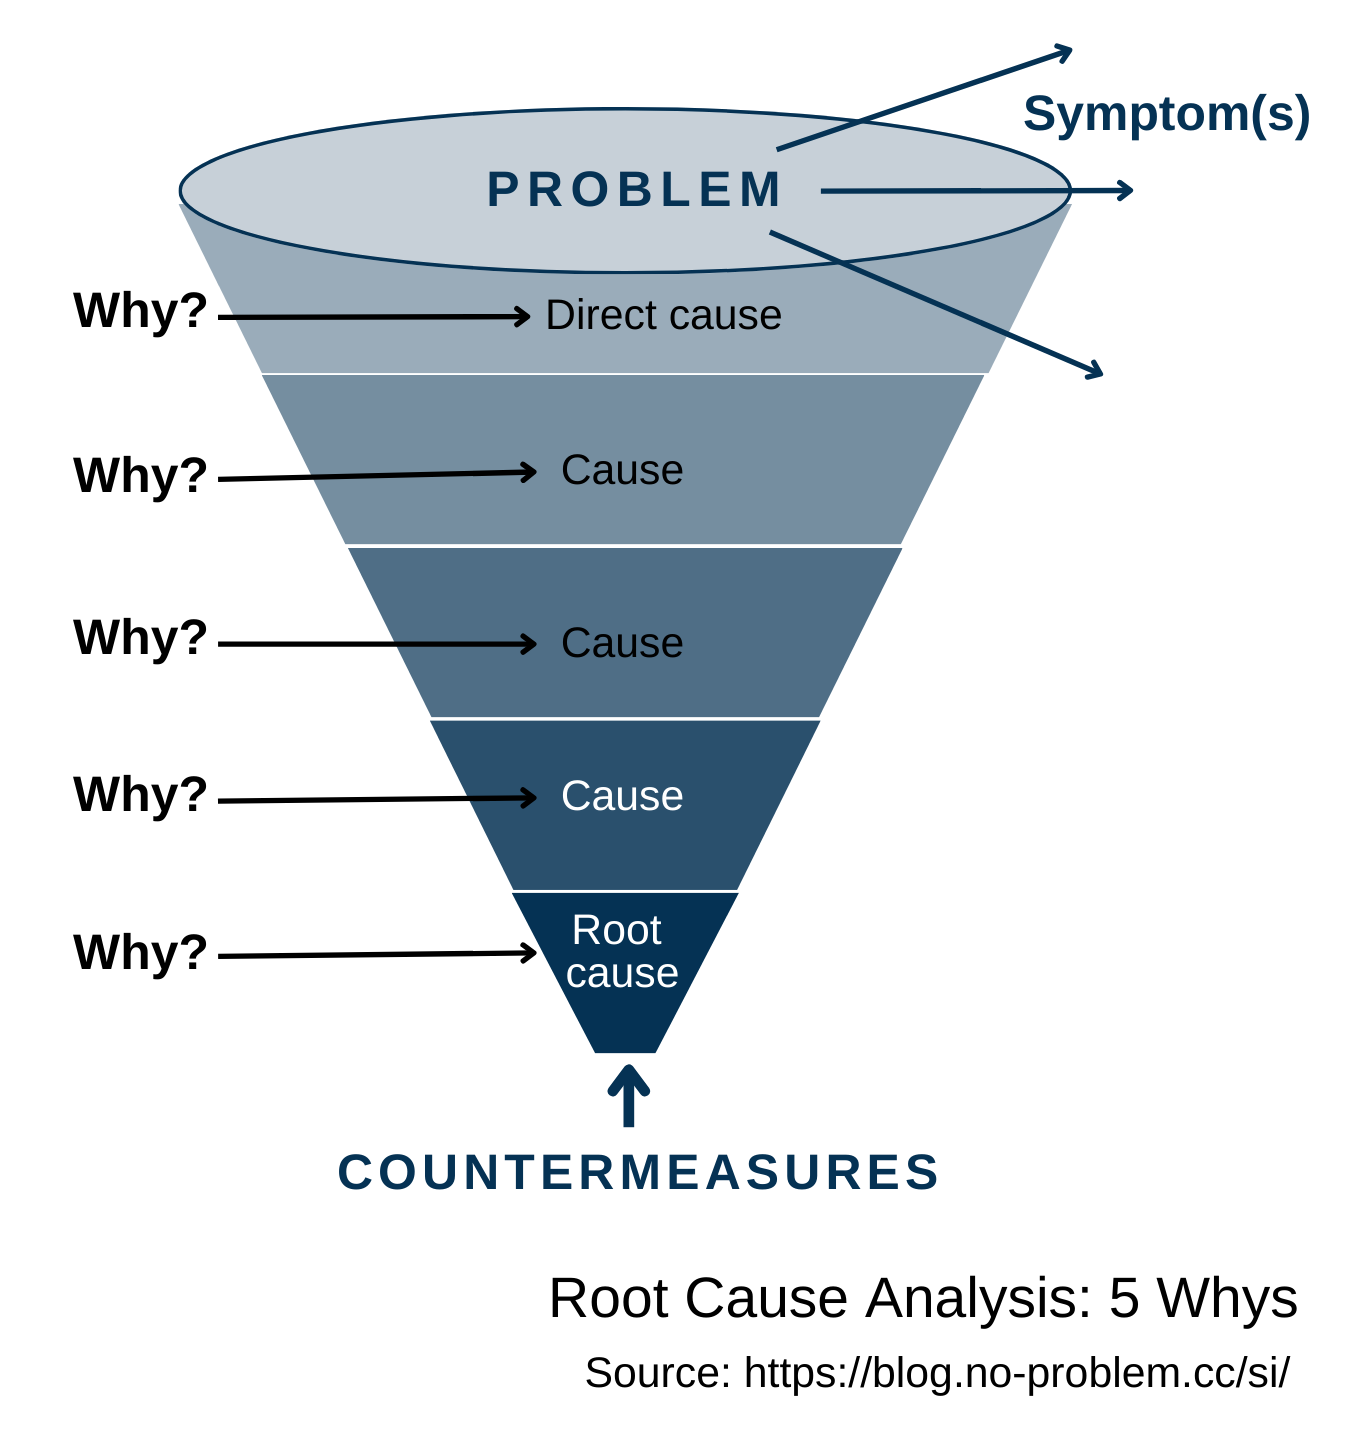
The primary goal of the method is to determine the root cause by repeating five times the increasingly granular “Why?” question about a problem or process. Most times, the answer to the fifth “Why?” is the root cause. To perform this analysis, it is necessary to see the issue, get the facts, and grasp the situation details. Usually, the outcome depends highly on the knowledge base of the investigator, his ability to avoid reasoning fallacies and dig to the root cause, rather than symptoms. Obviously, different people using it may come up with distinct causes for the same problem. Therefore, the results of the analysis should be validated. Nevertheless, the 5 Whys is a great brainstorming instrument to seek causes and can be effectively combined with other RCA methods.
Pareto analysis
Pareto charts are among the most well-known and widely applied tools in problem-solving and decision-making. It is a graphical representation of elements in a ranked bar chart. The main idea behind this is the Pareto Principle, named after Italian economist Vilfredo Pareto, or so-called the 80/20 rule. It states that 80% of consequences come from 20% of the causes. In other words, a few elements create more significance than all the others, and a problem-solver can almost always identify three to four causes that, if eliminated or improved, will have a crucial impact on the issue.
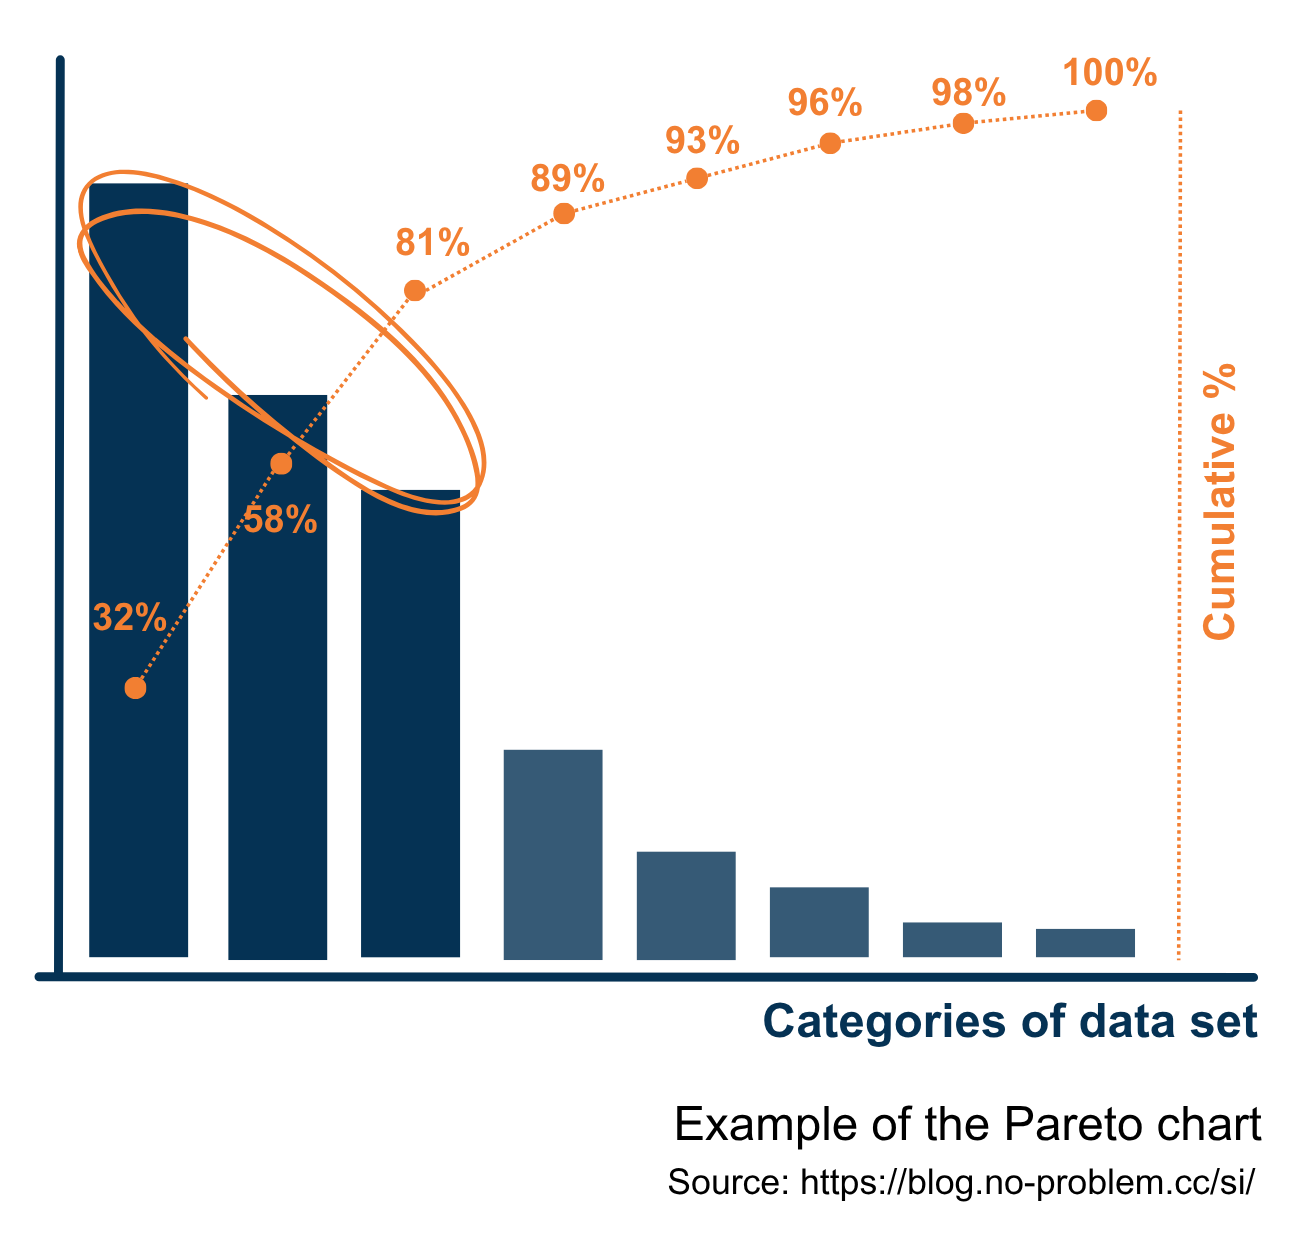 Among the revealed dominant causes, an analyst may select one, not necessarily the first on the top, to elaborate an action plan to fix this cause and to observe how the situation develops. The decision in which order to tackle the key causes depends on a variety of factors, like the complexity of the realization, available resources, and so on.
Besides strong analytical support, Pareto charts show complex data in a simple visual format that prevents misunderstanding of presented information and reduces tiptoeing around discovered findings. It allows narrowing the approach to a problem that has multiple causes or is too broad to address in a single change action. This method can be used separately or effectively combined with other qualitative and quantitative techniques.
Among the revealed dominant causes, an analyst may select one, not necessarily the first on the top, to elaborate an action plan to fix this cause and to observe how the situation develops. The decision in which order to tackle the key causes depends on a variety of factors, like the complexity of the realization, available resources, and so on.
Besides strong analytical support, Pareto charts show complex data in a simple visual format that prevents misunderstanding of presented information and reduces tiptoeing around discovered findings. It allows narrowing the approach to a problem that has multiple causes or is too broad to address in a single change action. This method can be used separately or effectively combined with other qualitative and quantitative techniques.
Ishikawa diagram
The cause-and-effect diagram, the fishbone diagram, and the Ishikawa diagram are different names of the same tool. It is based on the principle of simple causality and aims to identify potential causes of an issue. Using this method during brainstorming sessions encourages team members to generate ideas about likely problem causes and organize them logically. To give an impetus to analysis and make collaboration more productive, information is usually grouped into the following categories:
- People/ Manpower - causes induced by anyone who carries out or interacts with different aspects of an issue.
- Methods/ Procedures - the way things are done, whether by written documents or unwritten rules.
- Machines/ Technology – causes linked to equipment and specifics of applied technologies.
- Measurement/ Medium - matters caused by improper or poorly chosen measurement.
- Materials/ Information – causes that appeared because of defects of raw materials or wrong inputs into processes.
- Environment - immediate area surrounding the problem (e.g. humidity, temperature) and other essential physical factors, as well as culture, working climate, and so on.
- Management – causes produced by poor leadership and management mistakes.
- Maintenance – issues caused by inappropriate maintenance.
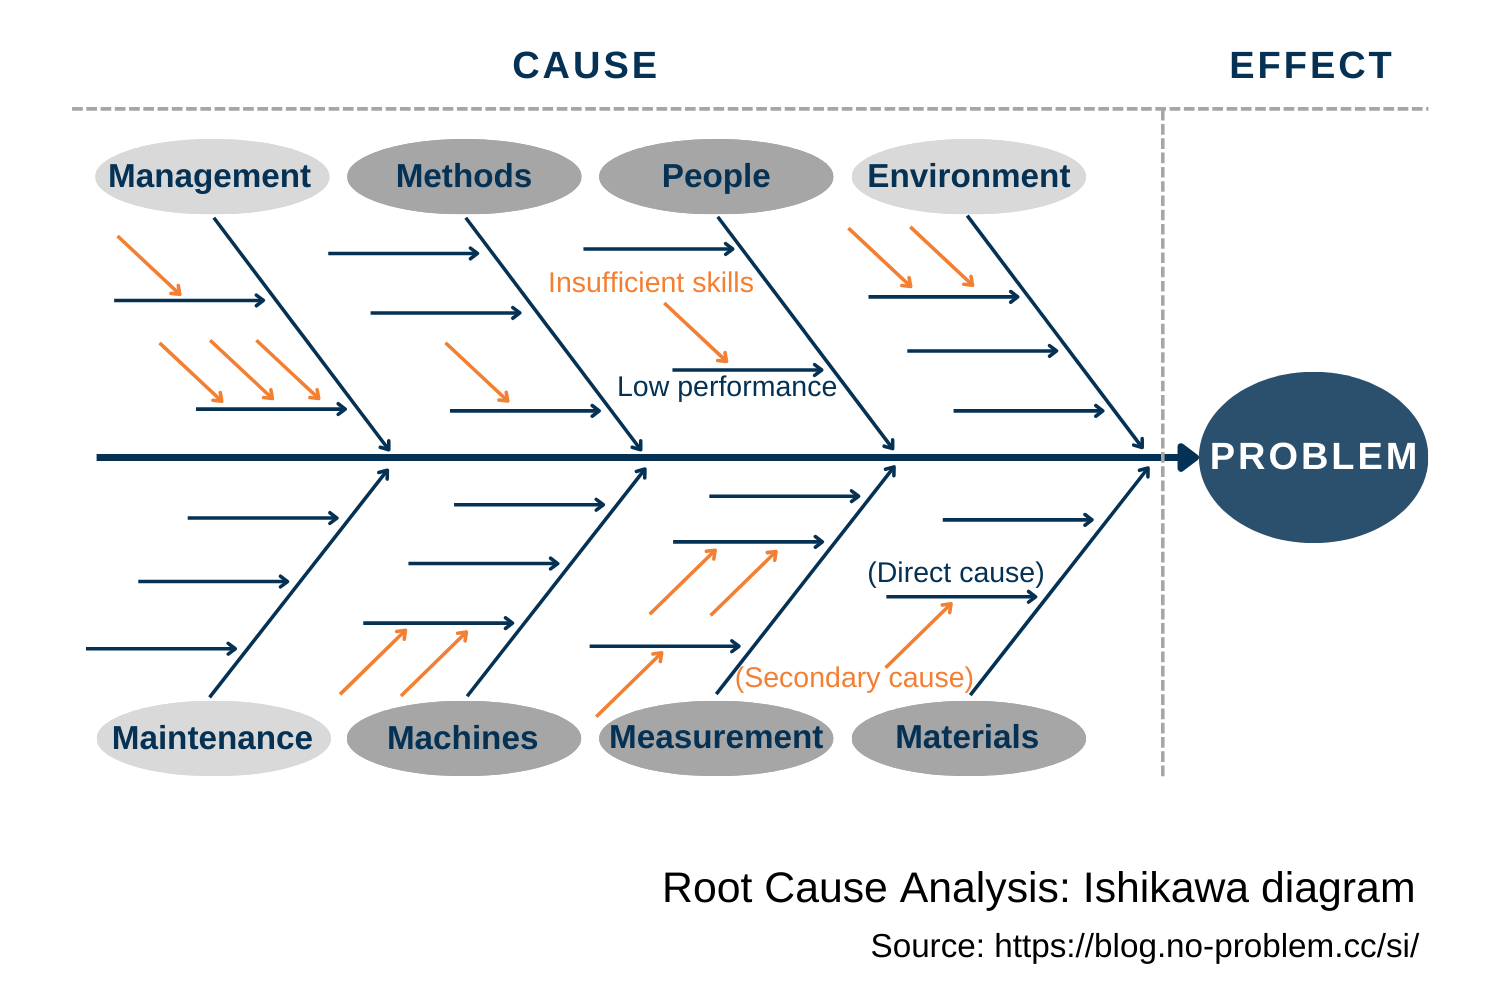
The Ishikawa diagram originates from the quality domain in a manufacturing environment. In lean production, the 5Ms (Manpower, Machines, Methods, Materials, Measurement) is one of the most utilized frameworks for root-cause analysis. The great adaptability of the tool allows an analyst to use it in other areas by expanding or shrinking the number of categories and tuning their meanings to fit the specifics of a business field. This method is often applied in a reactive mode to trace the root cause(s) of an existing problem. It can also help analyze trends and prevent potential pitfalls when designing a product.
Change analysis
Change analysis is a systematic process that is used for a single issue and focuses on elements that have changed. It looks at a problem by analyzing the deviation between the expected and actual outcomes to identify differences. Afterward, an investigator evaluates these discrepancies to determine their contribution to the occurrence. This technique comprises asking the questions:
- What? (conditions, occurrence, activity, equipment),
- When? (occurred, identified, status of facilities and conditions, schedule)
- Where? (physical location, environmental conditions)
- Who? (personnel involved and their qualifications)
- How? (planned/ standard actions, omissions, out of sequence procedure)
Responding to these questions should guide toward answering the root cause determination question: Why?
This is a simple and easy-to-grasp RCA method. However, the existence of a suitable ground for comparison is crucial for its reliability. For a comparative basis, the past experience, similar tasks, or detailed models can be used. The process starts with clear definitions of the deviated situation and the reference - a comparable activity that did not have the adverse consequences.
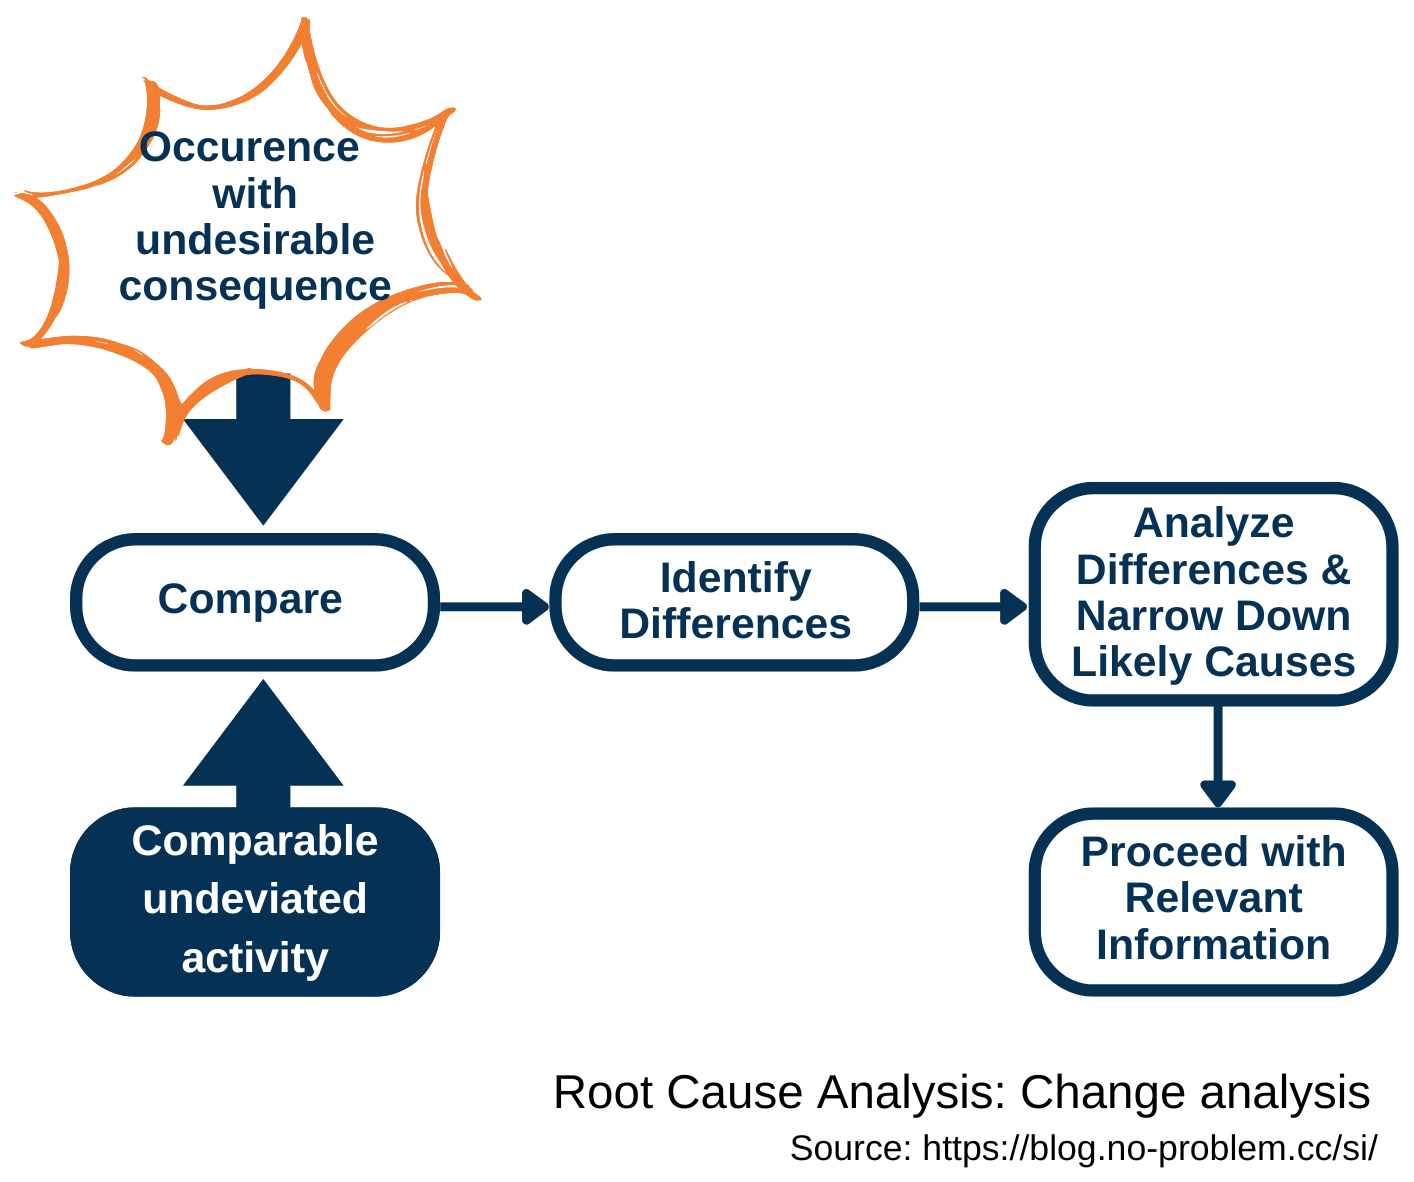 Then, a problem-solver is to compare the occurrence containing the undesirable consequences with the reference to reveal all changes or discrepancies that could have led to the deviation. In the next step, the popped-up differences should be investigated for their effects in producing the undesired outcomes. The investigation targets the most probable causes, which require the fewest additional assumptions. The results are translated into relevant recommendations for corrective actions.
The purpose of change analysis is to discover likely causes of a deviation, and if it is done without complementary validation of findings, there is a danger of accepting the wrong, “obvious” answer. This technique is a valuable add-on to support complicated problem-solving and works well in combination with other RCA methods.
Barrier analysis
This method has a dual purpose: to understand why a problem happened and how to prevent it. Health and safety management commonly uses barrier analysis to reduce workplace injuries. It can also be used in other areas where risk analysis and prevention play an essential role. This is a relatively simple technique that does not require a lot of resources for successful completion. If a problem-solver has a deep understanding of an issue and its environment, the investigation can be performed solo; otherwise, team brainstorming is a better option.
The three basic elements of barrier analysis are: the target, the hazard, and the barrier. Therefore, this method is also known as Target-Hazard-Barrier analysis.
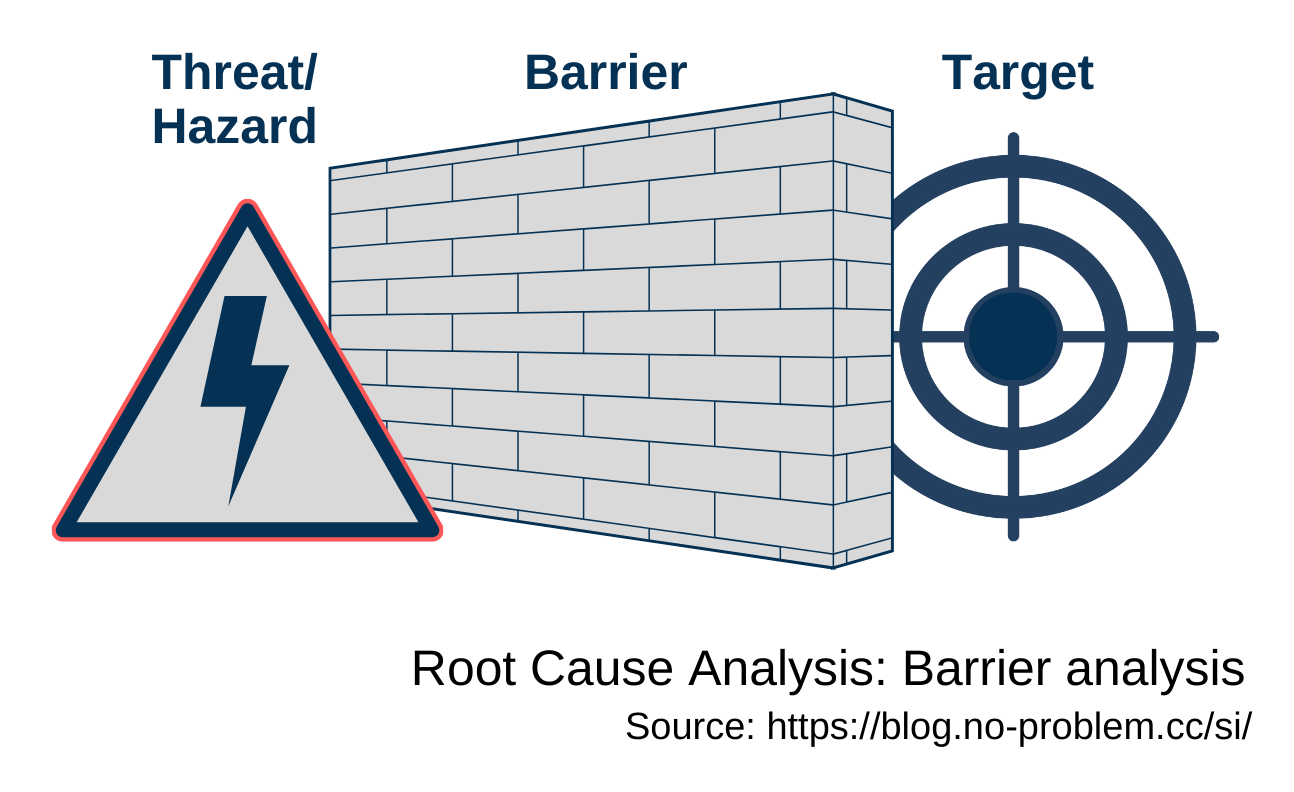
The target is something that is being selected to be fulfilled or protected (a person performing a job, quality of a product, outcome of a project, etc.). It needs to be maintained under a set of specific requirements.
A hazard is a possible way to harm the target or a cause that hurts it. Hazards are derived from different workplace categories (safety, physical, ergonomic, psychological, etc.), business risks (strategic, regulatory, financial, operational, reputational, etc.), or other threats related to the target.
A barrier prevents a negative effect from occurring and provides control over the hazard. The effectiveness of protection varies a lot and depends on the types, design, and amount of barriers, the chosen solutions to prevent the problem, defined standards and industry best practices, lessons learned from previous incidents, and so on.
A single barrier ensures one layer of protection for the target, which is taken as a physical, procedural, or individual action. Sometimes, there is a need for multiple layers to defend against failure. Combining this method with other RCA techniques can significantly increase its reliability.
Regression analysis
Regression analysis is the most effective instrument for constructing a model of the relationship between a dependent variable and one or more independent variables. Various tests are then employed to determine if the model is satisfactory in predicting the value of the dependent variable given values for the independent ones. A simple linear regression analysis estimates parameters in a linear equation that can be used to describe the relationship between a single dependent variable (possibly output) and a single independent variable (possibly input) and to predict how one variable might behave given changes in another variable. However, the changes are not necessarily an indication of the cause, only that the variables are intertwined in some way. Often, the results of a simple linear regression analysis are presented as a scatterplot with the regression line and the regression function.
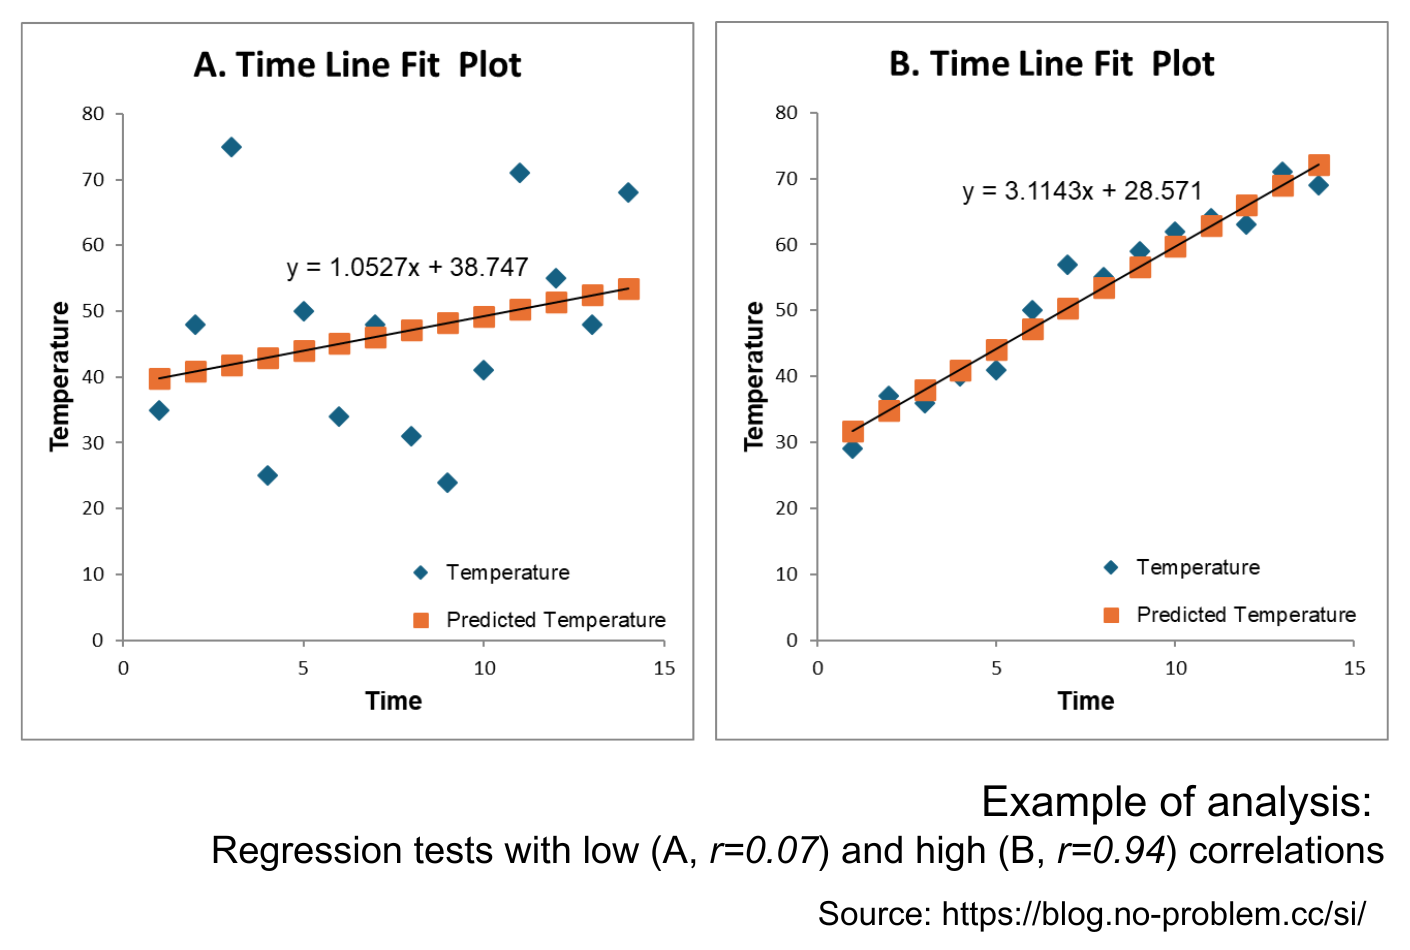
Regression analysis is tightly linked to correlation analysis. They both examine the same relationship between two quantitative variables from different angles. Regression investigates a form of the relationship, and correlation provides information on the strength and direction of this relationship. The most frequently used is the so-called “Pearson’s correlation” (r). It is obtained by dividing the covariance of the two variables by the product of their standard deviations. The Pearson correlation is +1 in the case of a perfect positive (increasing) linear relationship, −1 in the case of a perfect decreasing (negative) linear relationship (so-called, anti-correlation), and some value between −1 and +1 in all other cases, indicating the degree of linear dependence between the variables. As it approaches zero, there is less of a relationship (closer to uncorrelated). The closer the coefficient is to either −1 or +1, the stronger the correlation between the variables. The correlation coefficient measures only the degree of linear association between two variables. Conclusions about a cause-and-effect relationship are based on the judgment of a problem-solver only.
Correlation and linear regression are the most common techniques to investigate how two quantitative variables relate. Usually, correlation analysis is conducted first, and with the confirmed relationship, regression analysis examines its model.
Events and Causal Factors Analysis (ECFA)
Events and Causal Factors Analysis (ECFA) is used for multifaceted problems. It helps to verify causal chains and event sequences, provides a structure for integrating findings, and assists in the visualization of the analysis process and outcomes. The resulting chart is a cause-and-effect diagram that describes the time sequence of incidents and the surrounding conditions leading to an event.
Usually, an ECF chart incorporates the following elements and rules:
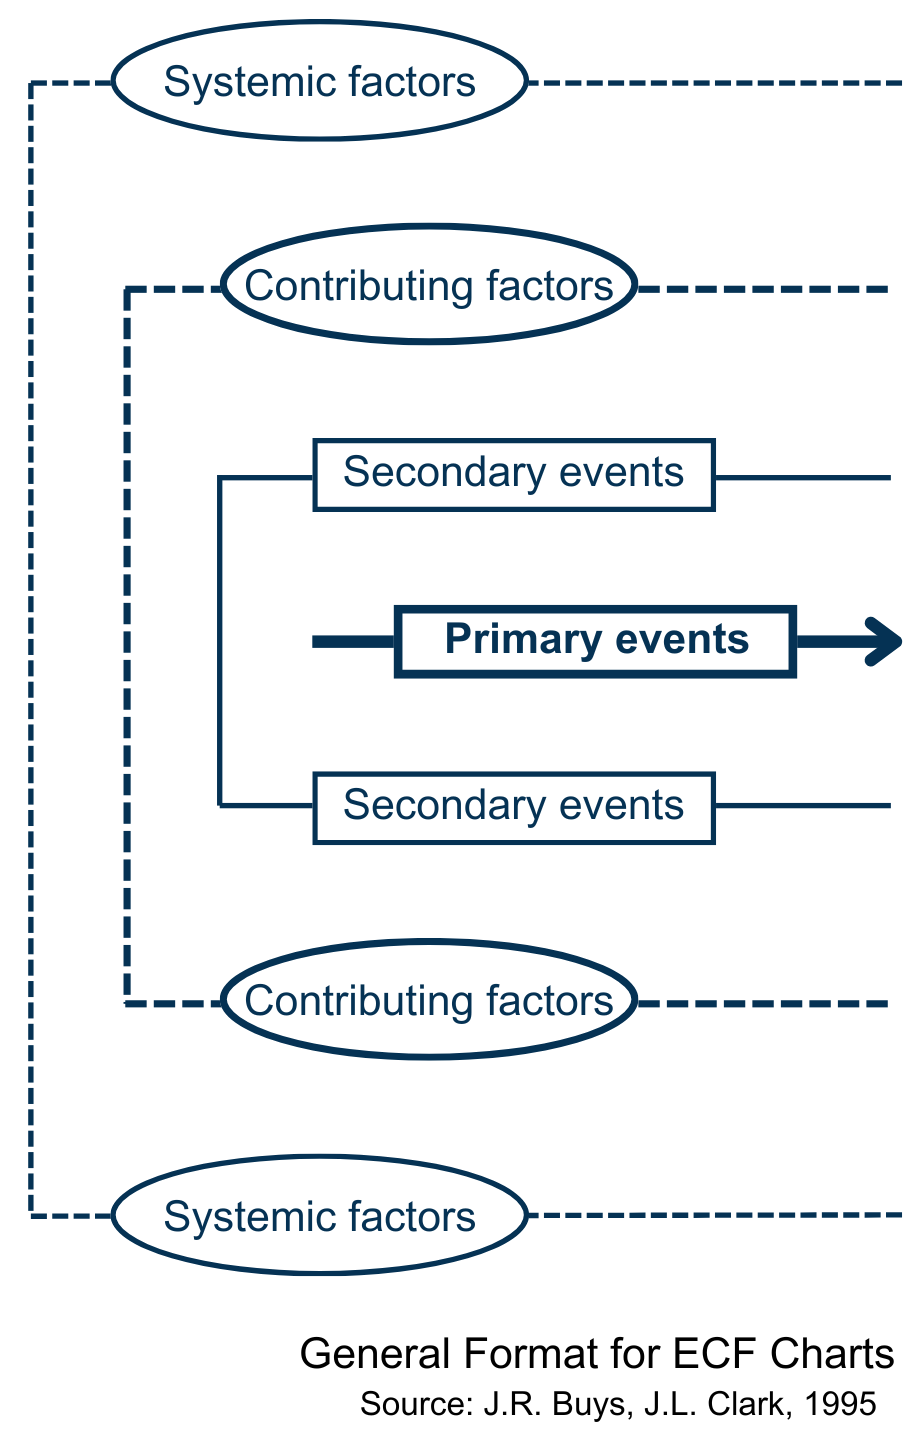
- Events are precise, brief descriptions of issues, logically sequenced and enclosed in rectangles. Each event should have only one subject and one action (formulated with an active verb), describe a single, discrete occurrence, and be quantified when possible.
- Conditions are passive instances and describe circumstances, or states that could have influenced the event. On the chart, they are drawn in ovals. When possible, they have to be quantified, posted with time and date, and derived directly from the conditions preceding them. To keep the level of detail manageable, include in the analysis only the conditions needed to explain the events.
- Arrows link chart elements: events should be connected by solid arrows; conditions are to be united to each other and to events by dashed arrows.
- Presumptive events and conditions — i.e. those that are not based on valid factual evidence, - should be indicated by dashed-line rectangles and ovals.
- At different levels above or below the primary sequence of events, secondary event sequences, contributing and systemic factors should be depicted.
ECFA is time-consuming and requires familiarity with the process of investigation and a broad perspective of the event to diagnose problems. Analysis involves manipulating data according to a set of rules to reveal the root cause(s) and to identify where deviations occurred from acceptable states. It intends to discover all cause-and-effect relationships from which corrective actions can be elaborated to reduce and handle loss-producing errors and improve an organization’s total performance. It starts with formulating the issue and accumulating facts about events and conditions. To get reliable results, an analyst has to focus on format and logic checks to organize the data on the issue, sharpen and guide the investigation, validate and confirm the true incident sequence, detect and validate factual findings, probable cases and contributing factors, and link specific factors to organization and management control aspects.
As with any model, it is a simplification of the real thing. Therefore, optimum results in a complex problem investigation can be achieved by combining ECFA with other tools, like risk tree analysis, change analysis, and barrier analysis.
Failure Mode and Effects Analysis (FMEA)
FMEA is a structured way to identify and address potential problems, or failures, and their effects on a system, a process, a product, or a service before an adverse event occurs. It is an analytical method of qualitative risk analysis. The basic logic applies at several levels, including organizational challenges, strategy issues, product design, production processes, and individual components. To take advantage of its preventive nature, it is worth using the tool as early as possible in the definition and planning project phases and periodically throughout the lifecycle of the process, product, or service. In a nutshell, the analyst team has to review, evaluate, and document:
- the aim and scope of the FMEA
- failure modes (What could go wrong? How badly it might go wrong?)
- failure causes (Why would the failure happen?)
- failure effects (What would be the consequences of each failure?)
- recommended changes/ actions (What needs to be done to prevent or mitigate the problem?)
Teams typically create FMEAs in a spreadsheet program, as some calculations are required during the process. It is also important to establish guidance scales to apply numeric values to describe the severity (how serious the impact is of the failure mode), occurrence (the likelihood or frequency of the given failure), and detection (how effective current methods are for detecting and/or preventing the failure).
Besides obvious advantages, there are some essential limits of the method that should be considered during its application:
- Only individual failures can be analyzed. The FMEA is not suitable for an examination of failure combinations.
- Evaluations from different FMEAs cannot be compared with one another because their results provide relative estimates, not absolute measures.
- Quantitative statements about the failure behavior of products/ processes/ systems/ services are not in the scope.
FMEA appeared in the US military and quickly gained credibility. In the 1960s, this method was adopted by NASA, and later taken up by the automotive industry. Nowadays, it is a core tool in product development in many companies and is part of an organization’s quality management system.
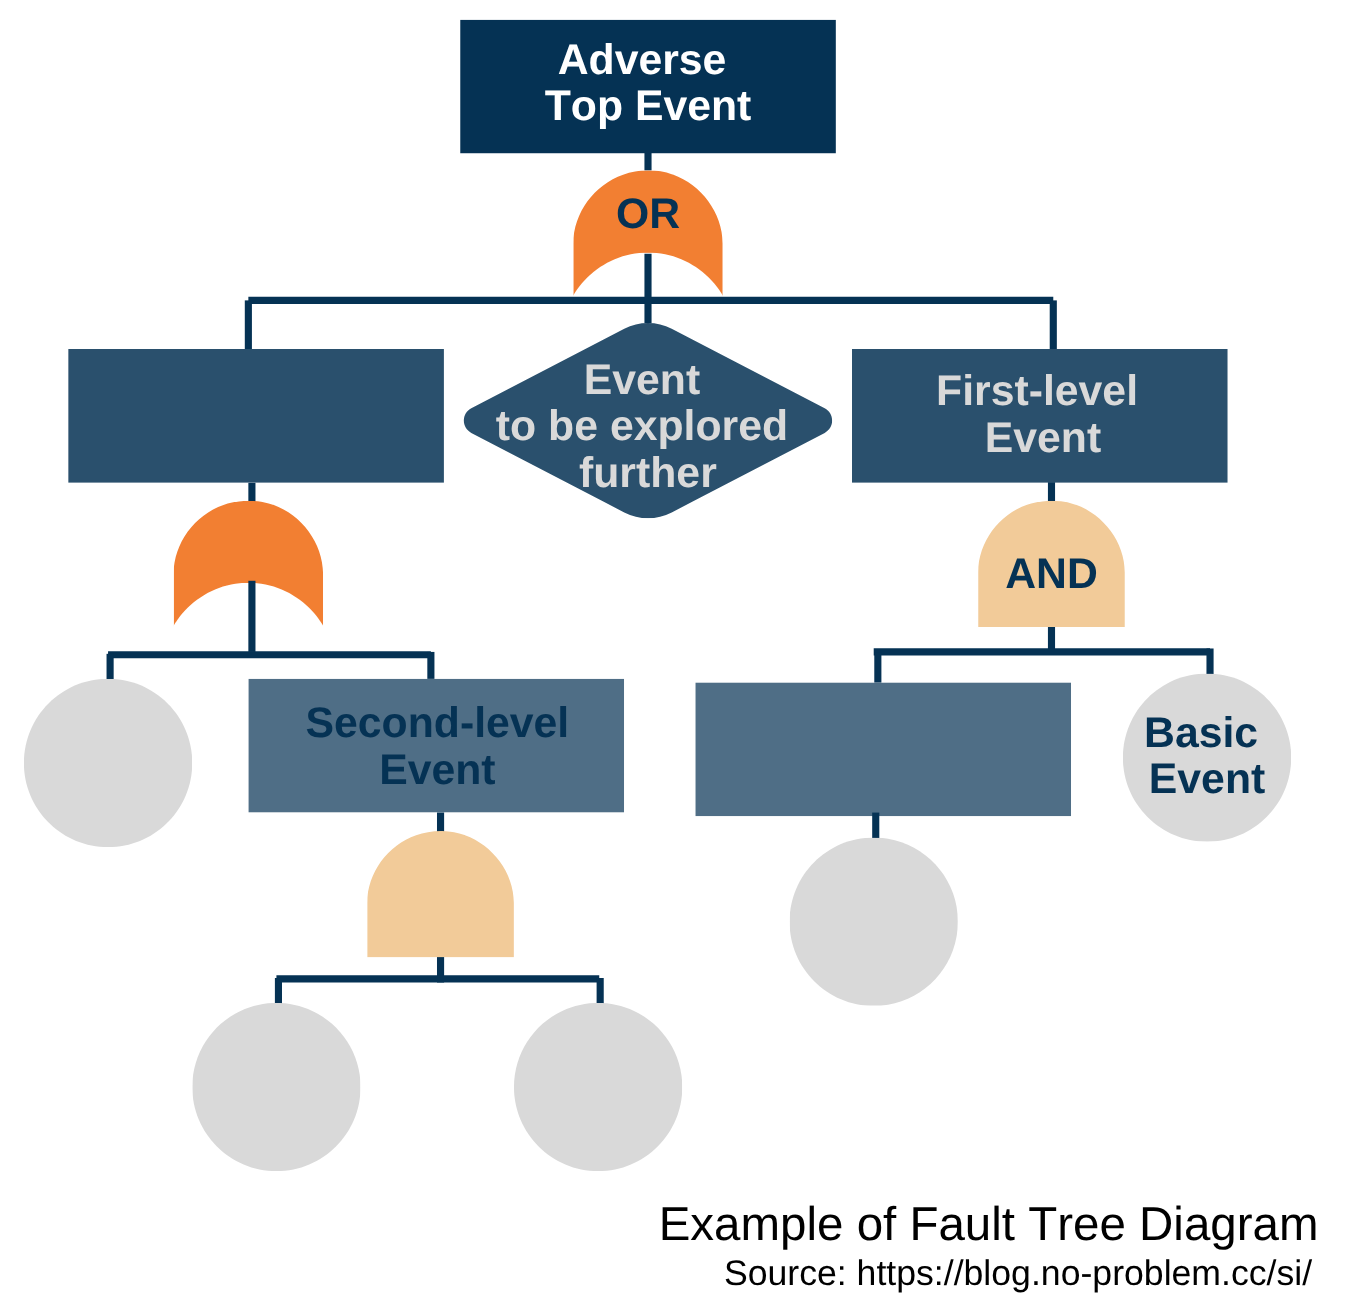
Fault Tree Analysis (FTA)
FTA is another powerful instrument used to identify and analyze potential problems within complex systems. The goal is to discover possible sets of causes that can lead to certain adverse occurrences, the so-called top-level events. A tree diagram is a visual representation and the central element of this method that introduces logical links (AND, OR gates) to model various combinations of errors and normal events and to capture how failures interact. Elaborating on a tree diagram starts with the item that branches into several, each of which branches further, and so on until one arrives at the basic event, for which the further breakdowns are not detailed.
General steps in creating such a diagram are the following:
- identify the purpose and scope of what has to be depicted,
- determine main nodes, i.e. primary data points or decisions,
- develop sub-nodes, i.e. investigate possible outcomes or subdivisions,
- organize the tree, i.e. arrange the items hierarchically, with the top event at the top and basic events at the bottom.
- iteratively review and refine to get the relevance.
Fault Tree Analysis provides a clear and structured approach to risk management and is commonly used in cases where reliability is paramount. An FTA process usually begins with an undesirable event. It is important to describe it precisely, but not too general or too detailed. In the next step, there is a need to analyze the context and determine the relevant scope. Then, an analyst team constructs the fault tree structure to understand the connections and performs qualitative analysis to identify possible causes and their combinations. Of interest are always “single points of failure”, i.e. items whose deviation alone would cause the negative event. However, often a set of elements is responsible for an error occurring. A combination of basic events that leads to the hazard is called a cut set. A minimal cut set is a set that cannot lead to the top-level failure if only one item of this combination is prevented. Minimal cut sets are computed from fault trees by combining the primary events with the respective boolean operators. The FTA finalizes by calculating the probability of the undesirable event, followed by comparison of variations and assessment of variants. The math behind these is not very complicated, but analyzing fault trees manually can be time-consuming and prone to errors. In practice, it is done with the appropriate software tools that simplify the process and ensure accuracy and efficiency.
FTA allows one to reason and to prove whether a certain combination of component errors is critical for system failure or not, and make quantitative statements on the adverse behavior of products or processes. The tool is highly adaptive and finds applications across various industries where system reliability, safety, and meeting compliance requirements are crucial for business success.
Kepner-Tregoe method
The Kepner-Tregoe root cause analysis and decision-making method provides a framework for gathering, organizing, prioritizing, evaluating information, and analyzing potential risks. It prevents overlooking any aspect of concerns, allows for making unbiased decisions, and incorporates four major stages:
- Situation appraisal to clarify the situation, outline concerns, set priorities, and plan the next steps.
- Problem analysis to describe the issue precisely, rank and weight objectives, identify and evaluate the causes, and confirm the true cause. This phase is similar to change analysis.
- Decision analysis to evaluate and score alternatives, assess the risks of each option, and make a final decision.
- Potential problem analysis to scrutinize the best option against potential future problems and negative consequences, and to elaborate risk mitigation actions.
This is a time-consuming instrument, and to use it properly, some training is required. If many factors are involved in a made decision, the scoring matrix becomes very complex. Therefore in practice, this method applies in making paramount decisions. No tool can guarantee that at a given time the right decision is taken; nevertheless, the Kepner-Tregoe approach assists in making the best possible choice of the available options.
There is a wide range of methods, tools, and techniques that aim to uncover the causes of problems. Some of them are more general; others are dedicated to specific situations and require a deep understanding of a method and its application area from a problem-solver. The RCA landscape is not limited by the above-mentioned techniques, and it is continuously developed and enriched by novel approaches and complementary tools.
References:
-
Root Cause Analysis. Guidance document. U.S. Department of Energy. DOE-NE-STD-1004-92, February 1992
-
Formal Fault Tree Analysis – Practical Experiences. F. Ortmeier, G. Schellhorn, Electronic Notes in Theoretical Computer Science, 185 (2007), 139–151
-
Events and Causal Factors Analysis. J.R. Buys, J.L. Clark, Technical Research and Analysis Center, SCIENTECH, Inc., August 1995
-
ECFA+ Events and Conditional Factors Analysis Manual. J. Kingston, F. Koornneef, the Noordwijk Risk Initiative Foundation, June 2014
-
Failure Mode and Effects Analysis (FMEA). Robert Bosch GmbH, June 2012
-
The New Rational Manager. C.H. Kepner, B.B. Tregoe, Kepner-Tregoe Inc, Princeton, NJ, 1997
Read this article on Medium